I asked ChatGPT for some python code to do distribution fitting and this is what it provided. I think I needed to edit it to fix some errors but it’s a nice solution.
First, I wanted to put in some R code that will allow me to display the results in blogdown, which is what I’m using to post to this site.
library(knitr)
library(reticulate)
knitr::knit_engines$set(python = reticulate::eng_python)
The following python code was used for distribution fitting. Note the fitted distribution is exponential with location and scale. When using fitdist function in R, it fits a one parameter exponential distribution and would give a different result.
import numpy as np
import scipy.stats as stats
import matplotlib.pyplot as plt
from scipy.stats import norm, expon, lognorm, weibull_min, gamma, beta, gumbel_r
# Your data
data = np.array([0.1026, 0.284, 0.0259, 0.0364, 0.0401, 0.0297, 0.1035, 0.0533, 0.0742, 0.0246,
0.089, 0.1215, 0.1729, 0.0212, 0.0273, 0.065, 0.0853, 0.0399, 0.1926, 0.1238,
0.4324, 0.1324, 0.0486, 0.0411, 0.0414, 0.0329, 0.02, 0.0749, 0.0688, 0.1432,
0.1769, 0.0415, 0.0939, 0.2315, 0.4017, 0.0751, 0.0669, 0.242, 0.1931, 0.0839,
0.0601, 0.0794, 0.145, 0.1439, 0.0415, 0.0523, 0.0413, 0.0701, 0.1141, 0.055])
# Fit different distributions and compare them
#distribution_names = ['norm', 'expon', 'lognorm', 'weibull_min', 'gamma', 'beta', 'gumbel_r']
distribution_names = ['expon','norm','lognorm','gamma']
params = {}
for distribution_name in distribution_names:
distribution = getattr(stats, distribution_name)
params[distribution_name] = distribution.fit(data)
# Find the distribution with the lowest AIC value
best_fit_distribution = min(params, key=lambda k: stats.kstest(data, k, args=params[k])[0])
best_params = params[best_fit_distribution]
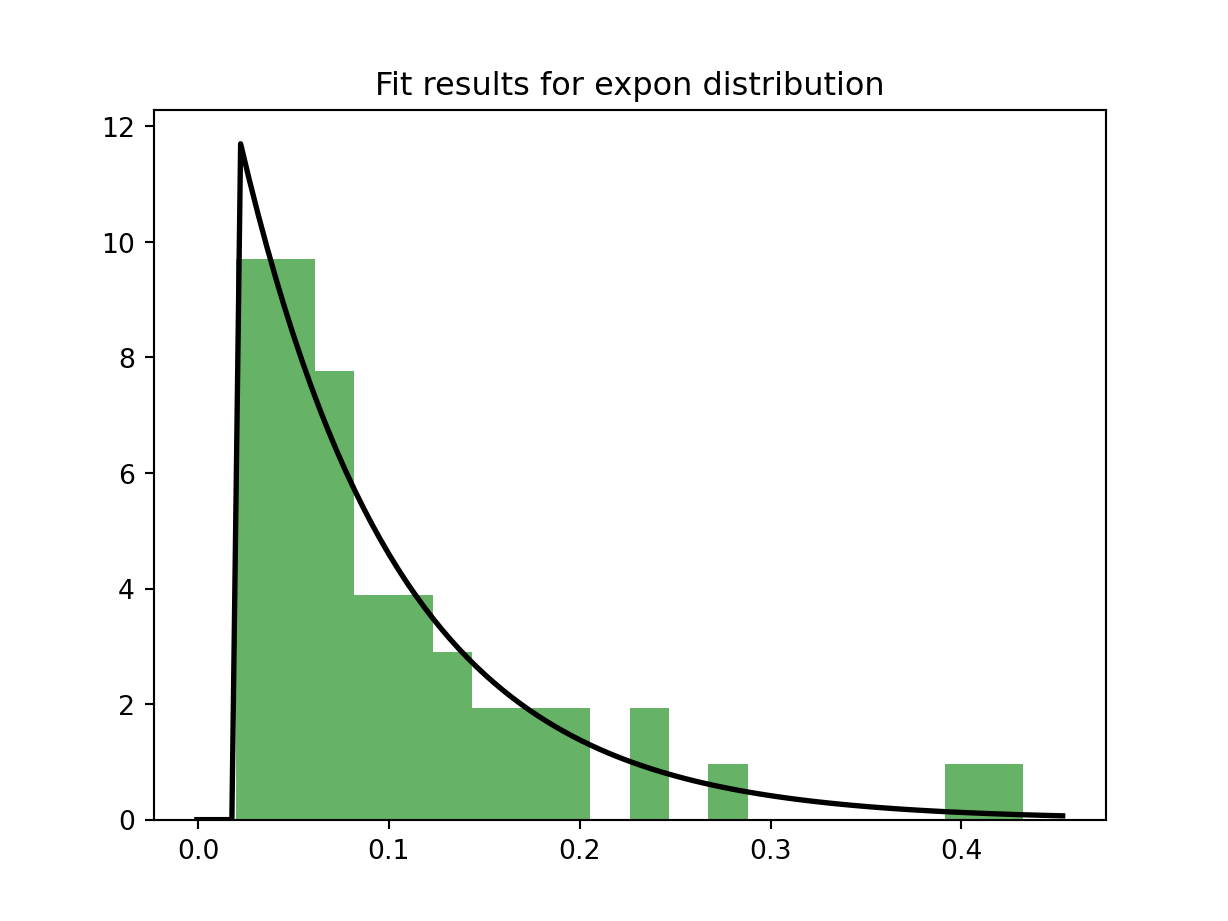
print(f"Best-fit distribution: {best_fit_distribution}")## Best-fit distribution: exponprint(f"Best-fit parameters: {best_params}")## Best-fit parameters: (0.02, 0.08315399999999998)# Plot the histogram of the data
plt.hist(data, bins=20, density=True, alpha=0.6, color='g')
# Plot the best-fit distribution
xmin, xmax = plt.xlim()
x = np.linspace(xmin, xmax, 100)
p = getattr(stats, best_fit_distribution).pdf(x, *best_params)
plt.plot(x, p, 'k', linewidth=2)
plt.title(f"Fit results for {best_fit_distribution} distribution")
plt.show()